Passive acoustic bubble spectroscopy
50 bubbles/second
|
|
|
|
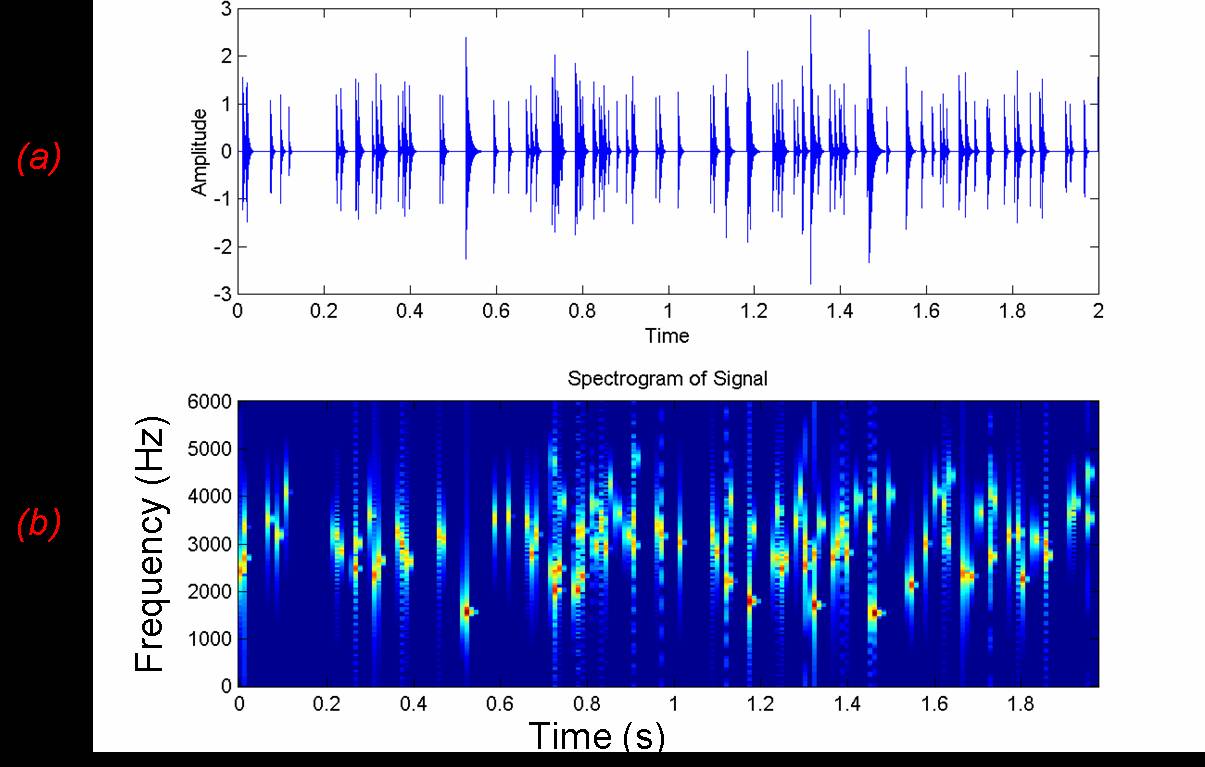
Here is a first example showing (a) the artificially constructed hydrophone signal when fifty bubbles per second are introduced without noise. The spectrogram of this signal is shown in (b). This plots high acoustic energy as ‘hot’ colours, distributed across frequency bands as indicated in the vertical axis, at times as marked on the horizontal axis. In the spectrogram it is easy to identify the frequency of the individual bubbles and their amplitude. You can hear this signal by clicking on the loud speaker, it is very easy to here the individual bubble signals. However it does not sound like realistic rain or a babbling brook. You can hear what it sounds like by clicking here.
|
|
|
|
|
|
|
|
Click here for the homepage of the Centre for Ultrasonics and Underwater Acoustics
